Our Books
Browse our 23 titles from our hand-picked authors
 New
New
 New
New


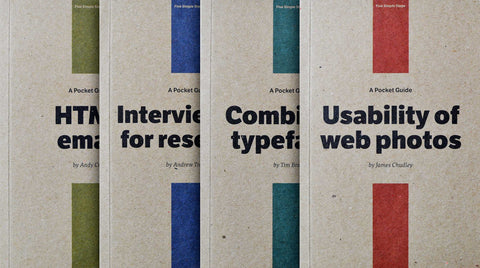


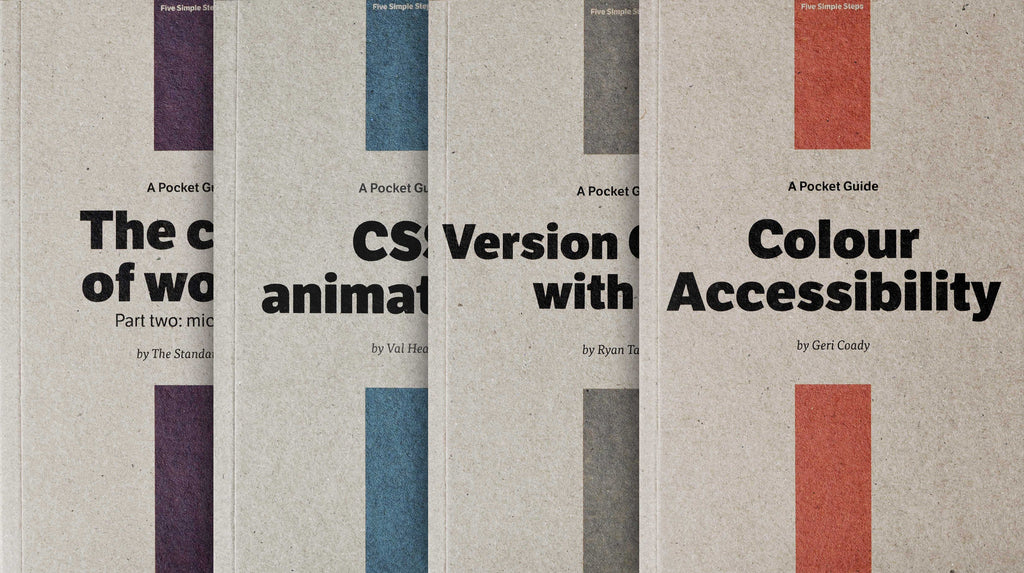
The Pocket Guide series: Collection 3
By The Standardistas, Val Head, Ryan Taylor, Geri Coady
A collection of step-by-step how-to guides, available in both paperback and digital formats.
What People Are Saying
“Most computer books are vast, full of irrelevant history and bloat, and produced on toilet paper. FSS are different: short, to-the-point books produced with care and a pleasure to read.”
“I'm a huge fan of the Five Simple Steps brand and products. They're constantly putting out superb content for such a small independent publisher. I'm a particular fan of the pocket guides. Often I'll need more than a blog post to learn from and less than a 500 page book. The pocket guides are digestible in one sitting: yum! Perfect.”
“There's something about a book which is more than a blog post or RSS feed. Even better when top quality topics/authors are being carefully & lovingly curated - which describes Five Simple Steps down to a tee.”
“There’s something wonderful about reading a beautifully printed, tangible book full of useful information pouring from every page. The Five Simple Steps catalogue has this in abundance, from their Pocket Guide series to Hardboiled Web Design and everything in between. These books will make you smarter, and your bookshelf more beautiful.”
“Five Simple Steps are a constant source of new inspiration - each book seems perfectly timed for where my head is at in the web world at any particular time. I've not yet read a FSS book that hasn't been packed full of valuable tips and that I've learned lots from. And I doubt that'll stop anytime soon!”
“Books from Five Simple Steps are always an insta-buy for me. The great variety of topics allows me to easily learn outside of my skill-set. The writing, editing and quality of their printed books is second to none. Top Stuff!”
“Five Simple Steps have consistently put out brilliantly practical books from people that really know their stuff. You know you'll get something really quality, written in a way you can relate to. It's an easy decision to order every pocket guide they do and learn about new areas through the larger print books.”
“If you look at my book shelf, you can find all the books by Five Simple Steps. Great independent publisher with a good variety of high quality books.”
“I love the Five Simple Steps range - they give me the practical information I need in just the right amounts, and the quality of the paper for the printed books means you never want to put them down.”
“The Five Simple Steps library has been indespensible to me though university and now in my role as a developer. They smell great too.”